Crashes involving large commercial trucks frequently lead to severe, life-altering events for those involved. These accidents can profoundly impact every aspect of victims’ lives, resulting in temporary, serious, or even fatal injuries.
The Cherry Hill truck accident attorneys at Cuneo & Leonetti took a closer look at the latest New Jersey truck accident data to try and contextualize the trends, locations, and risk factors associated with large truck crashes and their potential fatalities.
Table of Contents
- Key Findings
- Data Methodology
- New Jersey Bus & Truck Accident Trends
- Where Are New Jersey Truck Accidents Occurring?
- Where Are New Jersey Bus Accidents Occurring?
- How Does the Number of Lanes Impact Truck Accident Fatalities?
- How Does Road Surface Condition Impact New Jersey Fatal Truck Accidents?
- How Can Snowy Roads Cause New Jersey Semi-Truck Accidents?
- Legal and Liability Issues in New Jersey Truck Accidents
Key Findings
- Despite the total number of New Jersey large truck accidents steadily decreasing in recent years, 2021 fatal crash data shows that the fatality rate and total number of deaths from large truck accidents in New Jersey has increased.
- Highly populated New Jersey counties like Bergen, Essex, Middlesex, and Hudson County had the highest total reported truck and bus accidents from 2017-2024.
- Determined the top 25 most dangerous New Jersey roads and cities by total truck and bus accidents from 2017-2024.
- Two-lane roads made up a significant percentage of fatal truck accidents in New Jersey at over 46% with 182 total accidents reported.
- Over 58.7% of New Jersey’s large truck occupant deaths from 2017 to 2021 reported snow on the road’s surface at the time of the accident for a total of 27 reported deaths.
Data Methodology
This study uses the most recent Motor Carrier Management Information System (MCMIS) data collected from 2017-2024.
The MCMIS crash data includes crashes that are reported by states to the FMCSA through the SAFETYNET computer reporting system. A State reportable crash must:
- Involve a truck (a vehicle designed, used, or maintained primarily for carrying property, with a gross vehicle weight rating or gross combination weight rating of more than 10,000 lbs.) or bus (a vehicle with seats for at least nine people, including the driver)
- result in at least one fatality; one injury where the person injured is taken to a medical facility for immediate medical attention; or one vehicle having been towed from the scene as a result of disabling damage suffered in the crash.
Another source used within this analysis is the most recent Fatality Analysis Reporting System (FARS) data collected from 2017-2021.
The FARS is a census of crashes involving any motor vehicle on a traffic way, but only fatal crashes. It is generally considered to be the most reliable national crash database and is maintained by the National Highway Traffic Safety Administration (NHTSA). Some important definitions to note are:
- A large truck is defined in the FARS as a truck with a gross vehicle weight rating (GVWR) of more than 10,000 pounds.
- A bus is defined in the FARS as large motor vehicles used to carry more than 10 passengers, including school buses, inter-city buses and transit buses.
New Jersey Bus & Truck Accident Trends
Number of Truck and Bus Accidents From 2017-2024
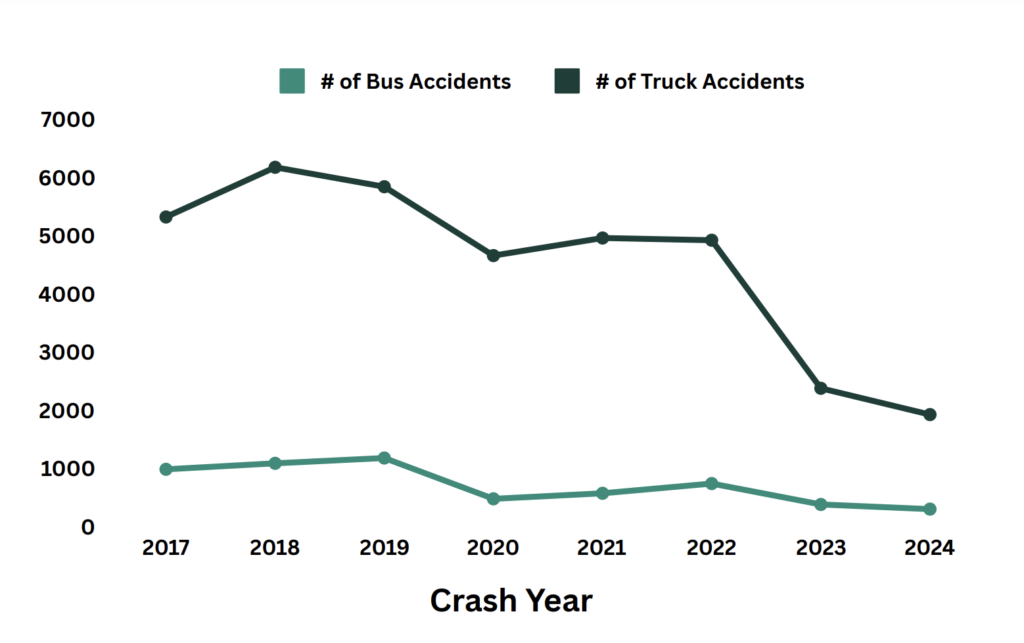
During the seven-year period from which this MCMIS crash data was collected, here are some notable trends and takeaways when looking at the number of reported truck and bus accidents from 2017-2024:
- Over time the amount of reported truck accidents has seen a significant decrease from a peak of over 6,000 reported accidents in 2018, to less than 2,400 reported accidents in 2023
- New Jersey bus accidents account for a much smaller figure of total reported accidents within this study, but they have also seen a decrease overtime from over 1,100 reported accidents, to just 392 accidents in 2023
- In 2023 there were 2,780 reported bus and truck accidents, while in each of the prior five-years there were never less than 5,000 total reported accidents
Number of Fatal Truck and Bus Accidents From 2017-2021
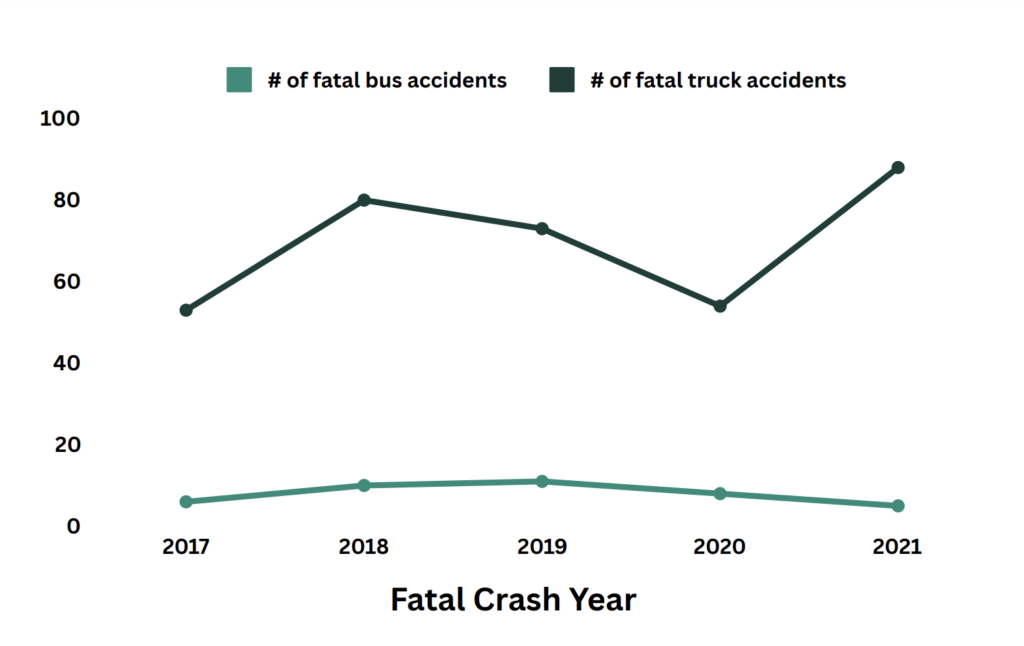
During the four-year period from which this FARS data was collected, here are some notable trends and takeaways when looking at the number of reported fatal truck and bus accidents from 2017-2021:
- When comparing the FARS truck accident data to the MCMIS findings, there was a similar slight decrease in total truck accidents and total fatal truck accidents reported from 2018-2020
- While 2018 had more total truck accidents reported, 2021 had the largest amount of fatal truck accidents at 88
- Contrarily, 2021 had the lowest amount of reported bus accident fatalities with just 5 total
New Jersey’s Large Truck and Bus Fatality Rate
| New Jersey | Fatalities | Million VMT | Fatality Rate |
| 2020 | 61 | 66341 | 0.09 |
| 2021 | 94 | 73.673 | 0.13 |
The Federal Motor Carrier Safety Administration used 2020 and 2021 truck accident crash data to compare the large truck and bus fatality rates by state using 100 million vehicle miles traveled (VMT) and total reported accident fatalities. Here are some takeaways concerning New Jersey:
- New Jersey saw an increase in large truck accident fatality rate in 2021, which is in line with both the FARS and MCMIS findings for 2021
- New Jersey’s fatality rate was well below the national average across all states, which was 0.18 in 2020 and 0.19 in 2021 respectively
Where Are New Jersey Truck Accidents Occurring?
Total New Jersey Truck Accidents by County From 2017-2024
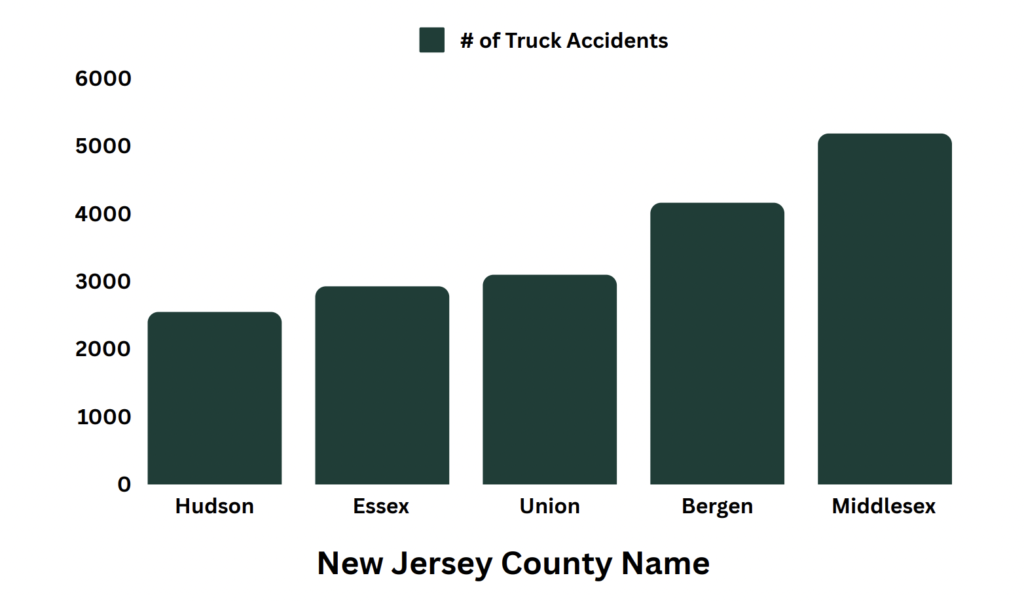
- Middlesex County – 5,189 truck accidents (14.31%)
- Bergen County – 4,165 truck accidents (11.48%)
- Union County – 3,100 truck accidents (8.55%)
- Essex County – 2,929 truck accidents (8.08%)
- Hudson County – 2,550 truck accidents (7.03%)
All five of the counties listed are within the top seven New Jersey counties by population size. It is notable that Union County accounts for more reported truck accidents than Essex and Hudson County, despite having a smaller population by over 200,000.
Top 25 Most Dangerous New Jersey Roads by Truck Accidents
The table below lists the top 25 most dangerous roads in New Jersey based on the total number of truck accidents, injuries, and fatalities reported from 2017-2024.
| Location | County Name | # of Accidents | Injuries | Fatalities |
| I-95, N.J. Turnpike | Middlesex | 1139 | 766 | 11 |
| I-95, N.J. Turnpike | Union | 809 | 429 | 8 |
| I-95, N.J. Turnpike | Bergen | 711 | 538 | 10 |
| Us 1 | Middlesex | 653 | 387 | 12 |
| Nj 17 | Bergen | 644 | 394 | 6 |
| I-80 | Morris | 608 | 382 | 22 |
| I-78 | Hunterdon | 583 | 330 | 6 |
| I-95, N.J. Turnpike | Essex | 512 | 267 | 9 |
| I-287 | Morris | 451 | 247 | 1 |
| I-287 | Somerset | 416 | 189 | 7 |
| Us 9 | Middlesex | 409 | 243 | 7 |
| I-95, N.J. Turnpike | Hudson | 403 | 237 | 5 |
| Us 1 | Union | 344 | 218 | 4 |
| Us 1 | Hudson | 302 | 199 | 5 |
| I-295 | Camden | 301 | 175 | 1 |
| I-287 | Middlesex | 290 | 163 | 1 |
| I-80 | Bergen | 288 | 180 | 3 |
| I-80 | Warren | 286 | 141 | 6 |
| I-78 | Union | 277 | 190 | 4 |
| I-78 | Somerset | 276 | 131 | 14 |
| Us 130 | Burlington | 275 | 200 | 9 |
| I-95, N.J. Turnpike | Mercer | 266 | 197 | 15 |
| Nj 18 | Middlesex | 265 | 135 | 1 |
| I-280 | Essex | 241 | 179 | 3 |
| I-295 | Burlington | 240 | 122 | 6 |
Top 25 Most Dangerous New Jersey Cities by Truck Accidents
When looking at the most significant counties and roads for truck accidents, it is also important to understand which cities carry the most risk. Here is a table that lists the top 25 most dangerous cities in New Jersey based on the total number of truck accidents, injuries, and fatalities reported from 2017-2024.
| City | County Name | # of Accidents | Injuries | Fatalities |
| Newark City | Essex | 1844 | 987 | 33 |
| Elizabeth City | Union | 1256 | 593 | 14 |
| Edison Twp | Middlesex | 961 | 623 | 8 |
| Woodbridge Twp | Middlesex | 882 | 571 | 12 |
| Jersey City | Hudson | 821 | 463 | 6 |
| South Brunswick Twp | Middlesex | 568 | 322 | 7 |
| Linden City | Union | 560 | 331 | 5 |
| Kearny Town | Hudson | 553 | 367 | 9 |
| Parsippany-Troy Hills | Morris | 488 | 272 | 9 |
| East Brunswick Twp | Middlesex | 444 | 226 | 1 |
| Paterson City | Passaic | 444 | 284 | 3 |
| Bridgewater Twp | Somerset | 435 | 231 | 7 |
| Clifton City | Passaic | 374 | 230 | 1 |
| Hamilton Twp | Mercer | 365 | 283 | 6 |
| Secaucus Town | Hudson | 359 | 220 | 2 |
| North Bergen Twp | Hudson | 357 | 222 | 5 |
| Teaneck Twp | Bergen | 322 | 185 | 2 |
| Mount Laurel Twp | Burlington | 319 | 212 | 8 |
| Bellmawr Boro | Camden | 311 | 182 | 3 |
| Union Twp | Union | 303 | 201 | 4 |
| Franklin Twp | Somerset | 295 | 157 | 1 |
| Fort Lee Boro | Bergen | 292 | 217 | 3 |
| Old Bridge Twp | Middlesex | 291 | 188 | 6 |
| Lakewood Twp | Ocean | 282 | 168 | 2 |
| North Brunswick Twp | Middlesex | 281 | 157 | 6 |
Where Are New Jersey Bus Accidents Occurring?
Total New Jersey Bus Accidents by County From 2017-2024
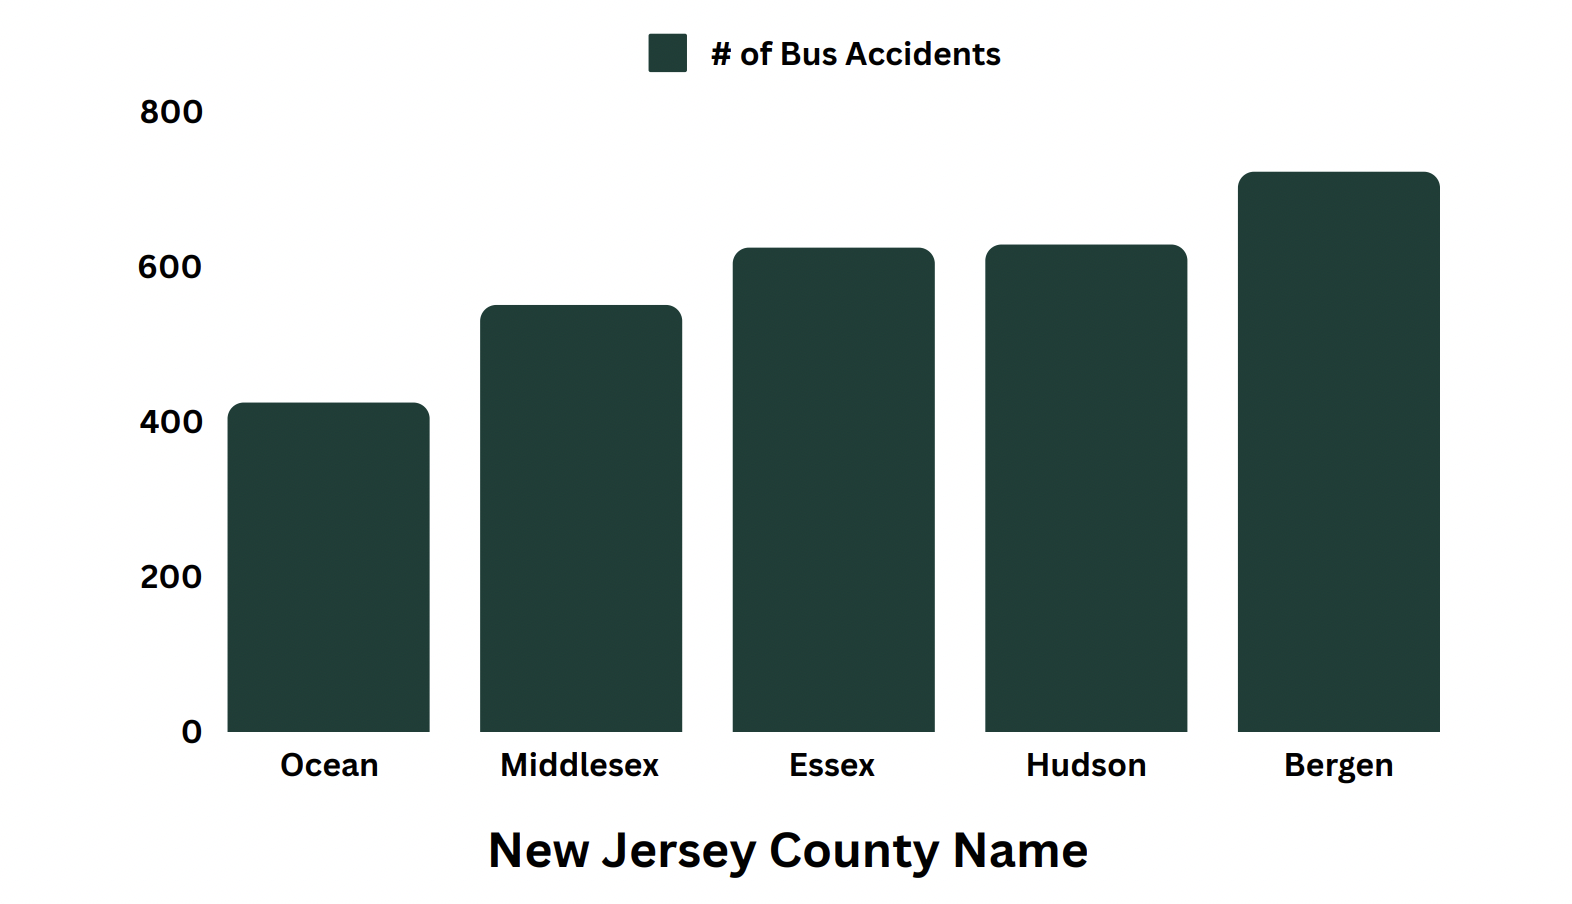
- Bergen County – 723 bus accidents (12.44%)
- Hudson County – 629 bus accidents (10.82%)
- Essex County – 625 bus accidents (10.75%)
- Middlesex County – 551 bus accidents (9.48%)
- Ocean County – 452 bus accidents (7.78%)
Even more so than for truck accidents, the top five counties for reported bus accidents are all within the top five counties by population.
Top 25 Most Dangerous New Jersey Roads by Bus Accidents
Here’s a table that includes the top 25 most dangerous New Jersey roads based on the total number of bus accidents, bus injuries, and bus fatalities reported from 2017-2024. There are some notable differences between these results and what we found for truck accidents in New Jersey.
| Location | County Name | # of Accidents | Injuries | Fatalities |
| Route 501 | Hudson | 66 | 62 | 1 |
| Us 9 | Ocean | 63 | 30 | 0 |
| Passaic County 601 | Passaic | 56 | 66 | 2 |
| Us 9 | Middlesex | 43 | 52 | 1 |
| Nj 4 | Bergen | 39 | 35 | 0 |
| Bergenline Ave | Hudson | 38 | 44 | 1 |
| I-95, N.J. Turnpike | Middlesex | 37 | 94 | 0 |
| Us 9 | Monmouth | 37 | 42 | 0 |
| Route 510 | Essex | 36 | 46 | 2 |
| Broad St | Essex | 35 | 30 | 0 |
| Us 30 | Camden | 35 | 47 | 1 |
| Nj 17 | Bergen | 33 | 23 | 0 |
| I-95, N.J. Turnpike | Hudson | 31 | 53 | 0 |
| I-95, N.J. Turnpike | Union | 31 | 21 | 0 |
| Route 503 | Bergen | 29 | 24 | 0 |
| Route 526 | Ocean | 29 | 12 | 0 |
| Route 528 | Ocean | 29 | 13 | 0 |
| Bergen County 29 | Bergen | 28 | 9 | 0 |
| Us 1 | Middlesex | 27 | 16 | 0 |
| Bergen County 39 | Bergen | 26 | 17 | 0 |
| Nj 495 | Hudson | 26 | 47 | 0 |
| I-80 | Morris | 25 | 91 | 3 |
| I-95, N.J. Turnpike | Bergen | 25 | 35 | 0 |
| Route 506 | Essex | 25 | 12 | 0 |
| Us 40 | Atlantic | 25 | 34 | 0 |
Top 25 Most Dangerous New Jersey Cities by Bus Accidents
Similarly, listed below are the top 25 most dangerous cities in New Jersey based on the total number of bus accidents, injuries, and fatalities reported from 2017-2024. These cities are also different from the ones we saw listed based on their truck accident totals.
| City | County Name | # of Accidents | Injuries | Fatalities |
| Newark City | Essex | 305 | 346 | 2 |
| Lakewood Twp | Ocean | 285 | 127 | 0 |
| Jersey City | Hudson | 242 | 247 | 0 |
| Paterson City | Passaic | 166 | 167 | 1 |
| Atlantic City | Atlantic | 92 | 85 | 0 |
| North Bergen Twp | Hudson | 88 | 98 | 0 |
| Elizabeth City | Union | 86 | 75 | 0 |
| Camden City | Camden | 85 | 90 | 4 |
| Edison Twp | Middlesex | 78 | 51 | 0 |
| Clifton City | Passaic | 78 | 68 | 1 |
| East Orange City | Essex | 68 | 88 | 0 |
| Hackensack City | Bergen | 67 | 57 | 0 |
| Teaneck Twp | Bergen | 67 | 66 | 0 |
| Hamilton Twp | Mercer | 67 | 118 | 1 |
| Union City | Hudson | 63 | 67 | 0 |
| Woodbridge Twp | Middlesex | 63 | 70 | 0 |
| Vineland City | Cumberland | 59 | 48 | 1 |
| Toms River Twp | Ocean | 59 | 30 | 0 |
| Old Bridge Twp | Middlesex | 58 | 62 | 1 |
| Franklin Twp | Somerset | 58 | 54 | 0 |
| Cherry Hill Twp | Camden | 55 | 83 | 4 |
| Trenton City | Mercer | 55 | 29 | 0 |
| Secaucus Town | Hudson | 54 | 68 | 0 |
| Weehawken Twp | Hudson | 52 | 49 | 0 |
| Fort Lee Boro | Bergen | 46 | 31 | 1 |
How Does the Number of Lanes Impact Truck Accident Fatalities?
Number of Lanes on the Road Where Fatal Truck Accidents Occurred (2017-2021)
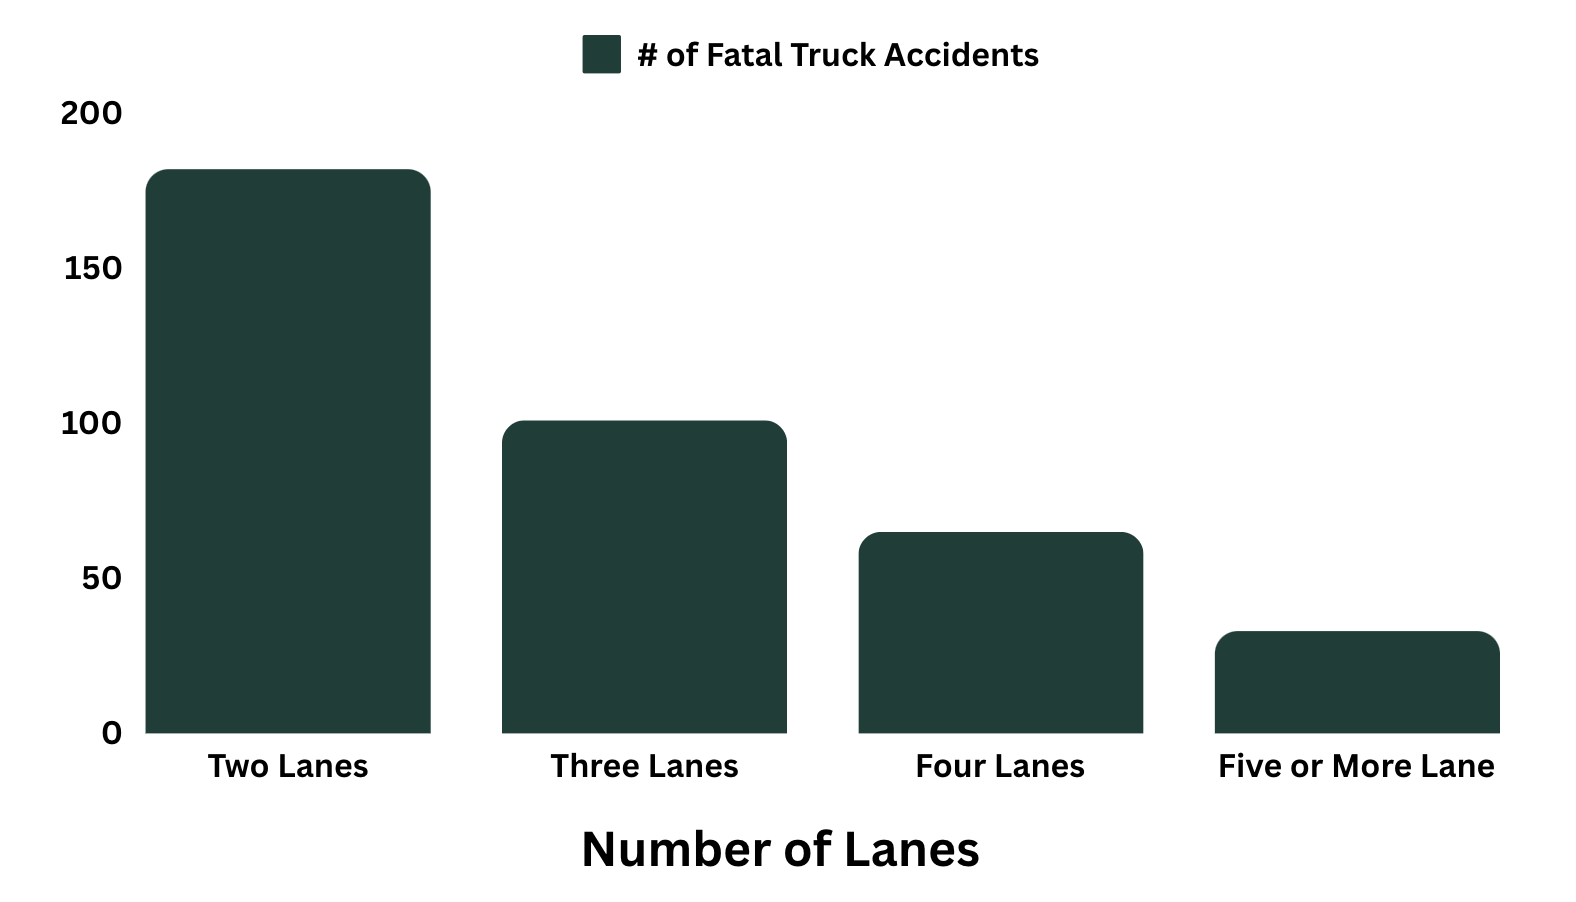
- One – 7 fatal truck accidents (1.8%)
- Two – 182 fatal truck accidents (46.9%)
- Three – 101 fatal truck accidents (26%)
- Four – 65 fatal truck accidents (19%)
- Five or More – 33 fatal truck accidents (16.8%)
It’s surprising to see that the majority of large truck accident fatalities occur in New Jersey on two-lane roads. Originally it could’ve been theorized that more lanes would result in a greater potential for serious fatal trucking accidents. This data suggests when the number of lanes is fewer and traffic is more condensed, the likelihood of a significant truck accident may increase.
Safety Tips for Navigating Around Semi-Trucks
Knowing how dangerous semi-truck accidents can be, specifically when New Jersey vehicles are trying to maneuver two or three-lane roads, here are some tips to minimize your risk of a fatal accident:
- Avoid Blind Spots: Stay clear of a truck’s blind spots, especially directly behind, alongside the cab, and close in front of the truck. If you can’t see the driver in their mirror, they likely can’t see you.
- Pass Quickly and Safely: When overtaking a truck, pass quickly on the left side (the truck’s least blind side) and avoid lingering in its blind spots.
- Maintain Safe Following Distance: Keep a significant gap when driving behind a truck. Large trucks require more time to stop, and they can block your view of traffic conditions ahead.
- Be Aware of Wide Turns: Semi-trucks need extra space to turn, often swinging wide before making the turn. Never try to squeeze between the truck and the curb during turns.
- Signal Early and Clearly: Use turn signals well in advance to give truck drivers time to adjust. Trucks have slower maneuverability, so they need more warning of your intentions.
- Be Cautious in Bad Weather: Trucks are more challenging to control in adverse weather. Increase your following distance and be extra careful when conditions are slippery or visibility is low.
- Stay Calm and Patient: Don’t try to cut off a truck or make aggressive moves. Allow them space and time, especially in high-traffic situations or on busy highways.
Serious semi-truck accidents can have devastating consequences on those involved and their families. In the event a tragic injury or death occurs as a result of another’s negligence, the Cherry Hill fatal injury lawyers at Cuneo & Leonetti are prepared to help.
How Does Road Surface Condition Impact New Jersey Fatal Truck Accidents?
Road Surface Condition When Fatal Truck Accident Occurred (2017-2021)
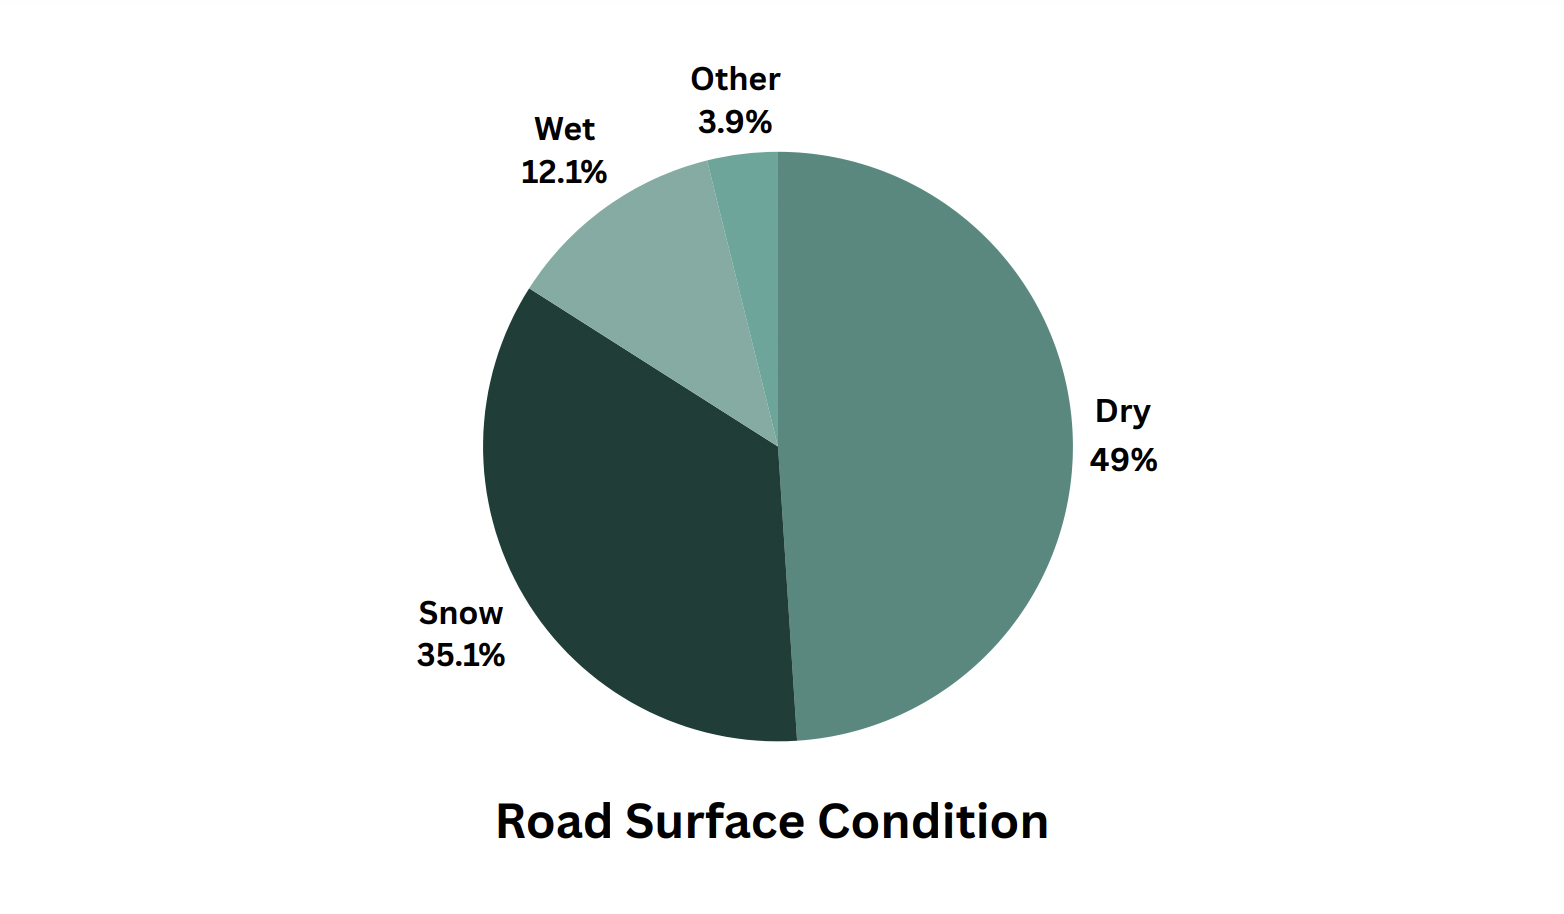
- Dry – 190 fatal truck accidents (48.9%)
- Snow – 136 fatal truck accidents (35.1%)
- Wet – 47 fatal truck accidents (12.1%)
- Other – 15 fatal truck accidents (3.9%)
Snow was listed as a road surface condition for 35% of all the fatal truck accident crashes reported, which is significant because snowy road surfaces only account for 2% of all truck or bus accidents reported from 2017 to 2024.
Out of the 136 fatal truck accidents with snowy road surface conditions, 27 of them reported a truck occupant fatality. This accounts for 58.7% of the truck driving occupant deaths reported from 2017 to 2021.
How Can Snowy Roads Cause New Jersey Semi-Truck Accidents?
Snowy roads pose significant dangers, especially for large trucks, due to the combination of poor visibility, reduced traction, and longer stopping distances. These factors can turn routine drives into hazardous trips, increasing the likelihood of severe accidents.
Key Factors in Snow-Related Truck Accidents
- Reduced Traction: Snow and ice make road surfaces slippery, leading to a significant reduction in traction. Trucks, with their heavy loads and large tires, may struggle to maintain control. Even with anti-lock braking systems and other safety features, the risk of skidding or jackknifing increases dramatically.
- Longer Stopping Distances: Trucks already require more distance to stop compared to smaller vehicles. On snowy roads, this semi-truck stopping distance increases substantially. If a truck driver is unable to account for this while driving, it could lead to rear-end collisions or multi-vehicle pileups.
- Roadway Conditions and Maintenance: Snowy roads can be particularly treacherous if they haven’t been properly treated with salt or sand. Unplowed or poorly maintained roads can quickly become slippery and uneven, making it harder for trucks to maintain stability, especially when navigating curves or steep inclines.
- Driver Fatigue and Inexperience: In snowy conditions, even experienced truck drivers can struggle to manage their vehicles. Fatigue or inexperience in winter driving can lead to overcorrections, panic braking, or other dangerous maneuvers that increase the likelihood of an accident.
- Speeding and Overconfidence: Truck drivers who underestimate the dangers of snowy roads may continue driving at speeds that are unsafe given the conditions. Overconfidence in a truck’s capability or an underestimation of how slick the roads are can lead to catastrophic consequences.
Legal Help for New Jersey Truck Accident Injuries
For Pennsauken truck accident cases, Camden truck accident victims, or Collingswood semi-truck accident compensation, our experienced truck accident attorneys can help victims navigate the complexities of truck-related injury claims. They can investigate the cause of the accident, determine if negligence or unsafe practices contributed to the injuries, and pursue the compensation you deserve for medical expenses, lost wages, and pain and suffering.
Truck accidents can result in severe injuries, even when safety precautions are followed. The sheer size and weight of commercial trucks increase the risk of significant harm during a collision. If you or your loved one has been injured in a truck accident, it’s essential to seek legal assistance to understand your options for compensation.
Legal and Liability Issues in New Jersey Truck Accidents
Even when truck accidents occur on snowy roads, multiple parties may be liable, including the truck driver, the trucking company, or even government entities responsible for road maintenance. Establishing fault in these cases often requires expert analysis of the weather conditions, the driver’s actions, and whether proper safety measures were taken.
For anyone involved in a truck accident, it’s crucial to consult with an experienced Cherry Hill accident attorney who can assess the situation, determine liability, and ensure that victims receive appropriate compensation for their injuries or damages.